Data Visualisation at Optiver: Streamlining trading decisions
Data visualisation is at the core of effective decision-making in the fast-paced, data-driven world of trading. For Optiver’s traders to access the information they need right when it matters, it’s crucial to display data intuitively and meaningfully.
In this blog post, we’ll take you behind the scenes of data visualisation at Optiver and explore how our engineers collaborate with traders to optimise workflows, manage compute power and tackle the challenges of latency and volume through innovative technological solutions.
Trading data visualisation challenges
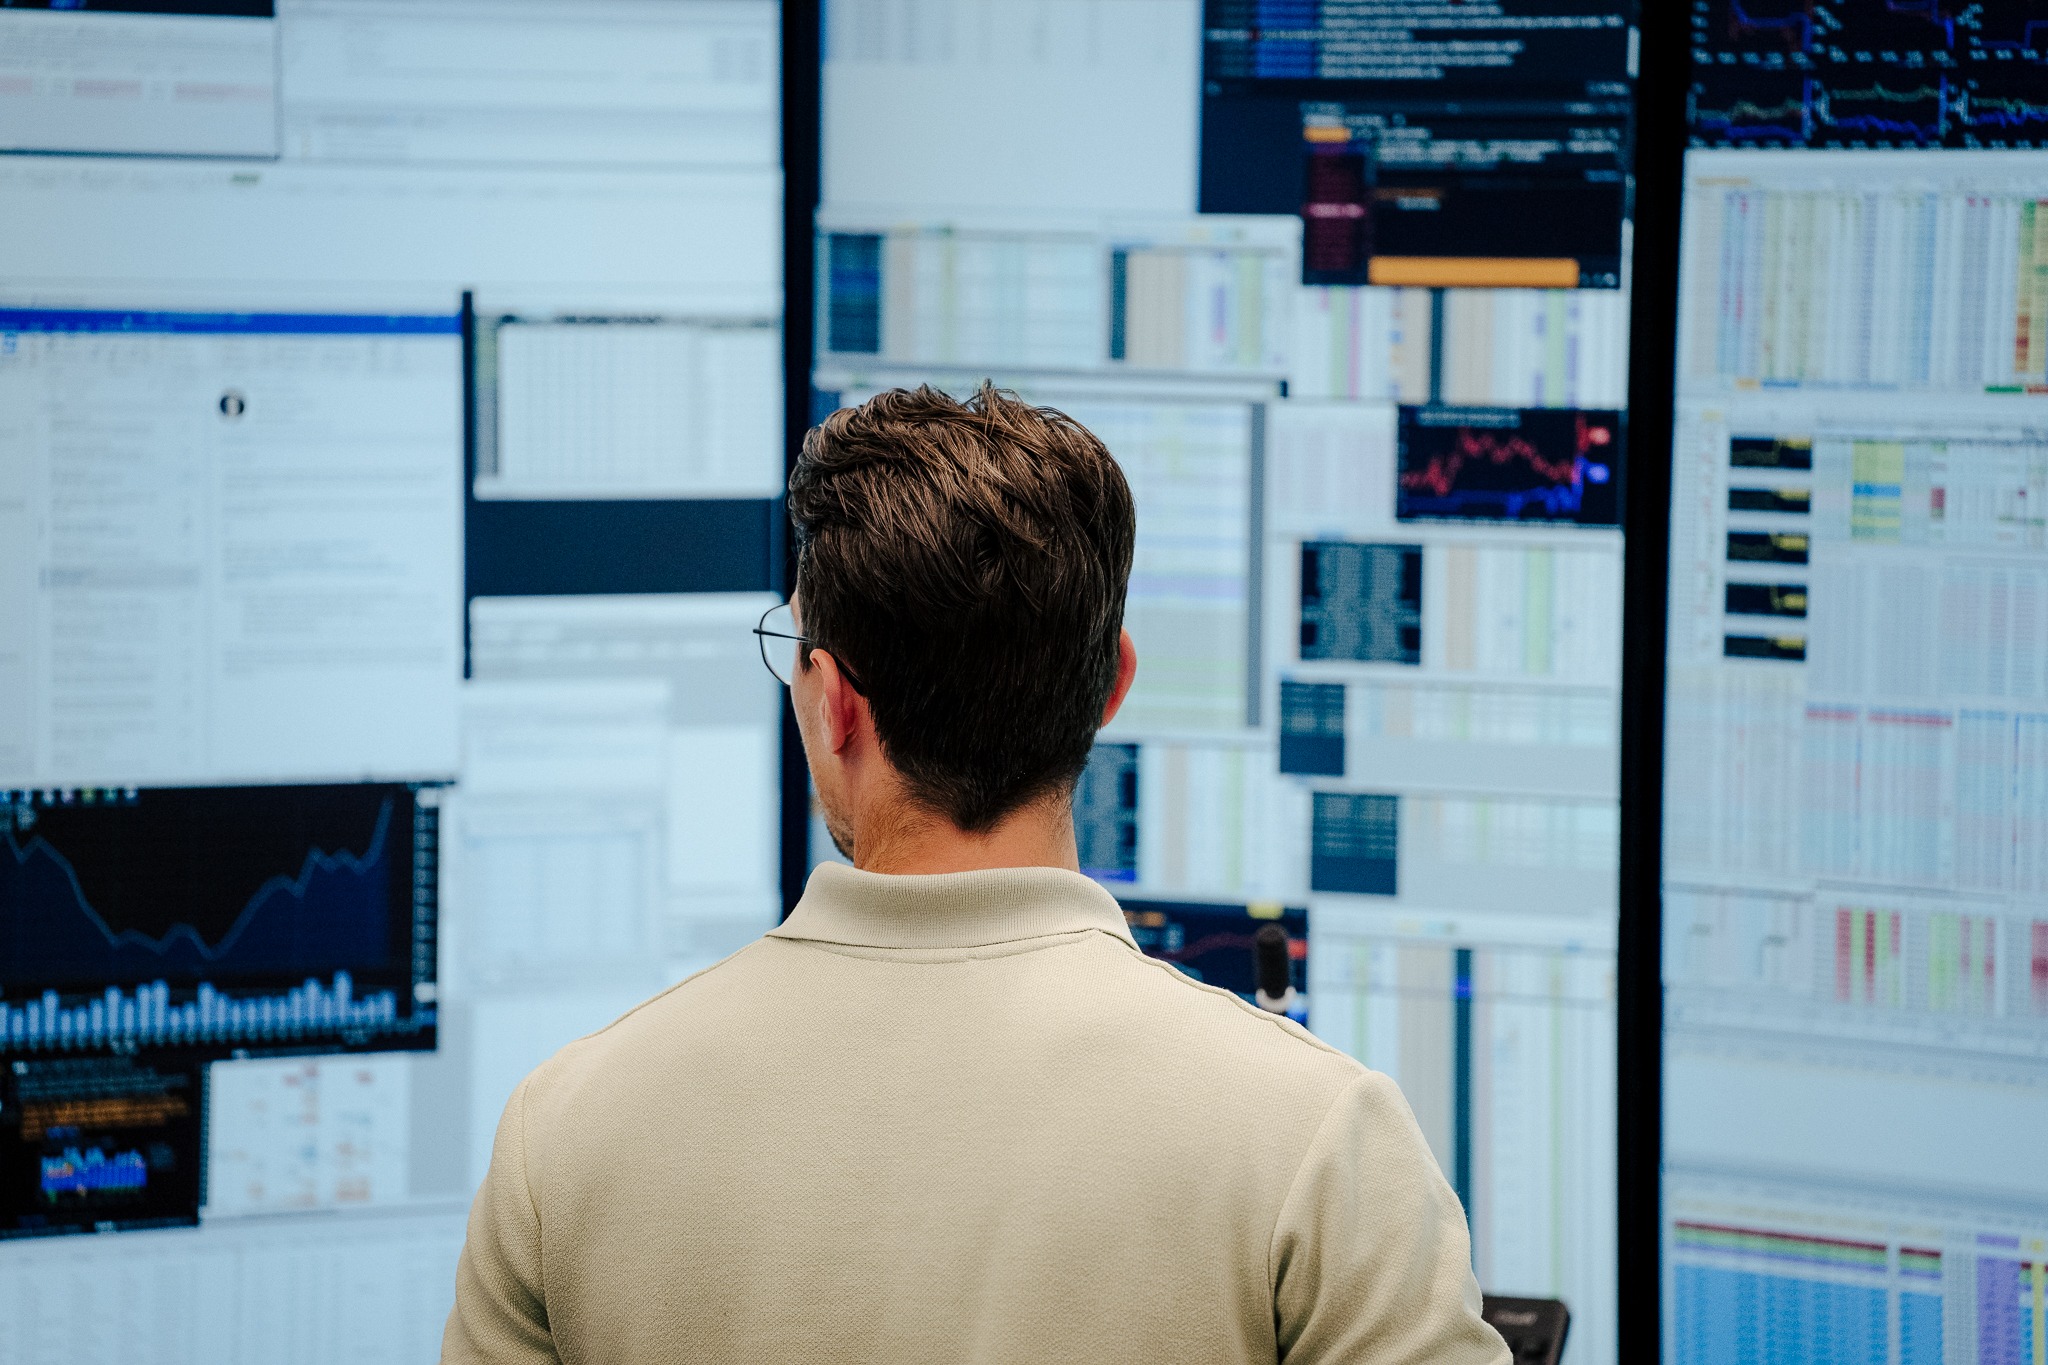
One of the biggest challenges in data visualisation at trading firms like Optiver is handling the massive volume of real-time and historical data while minimising latency and ensuring meaningful visualisations.
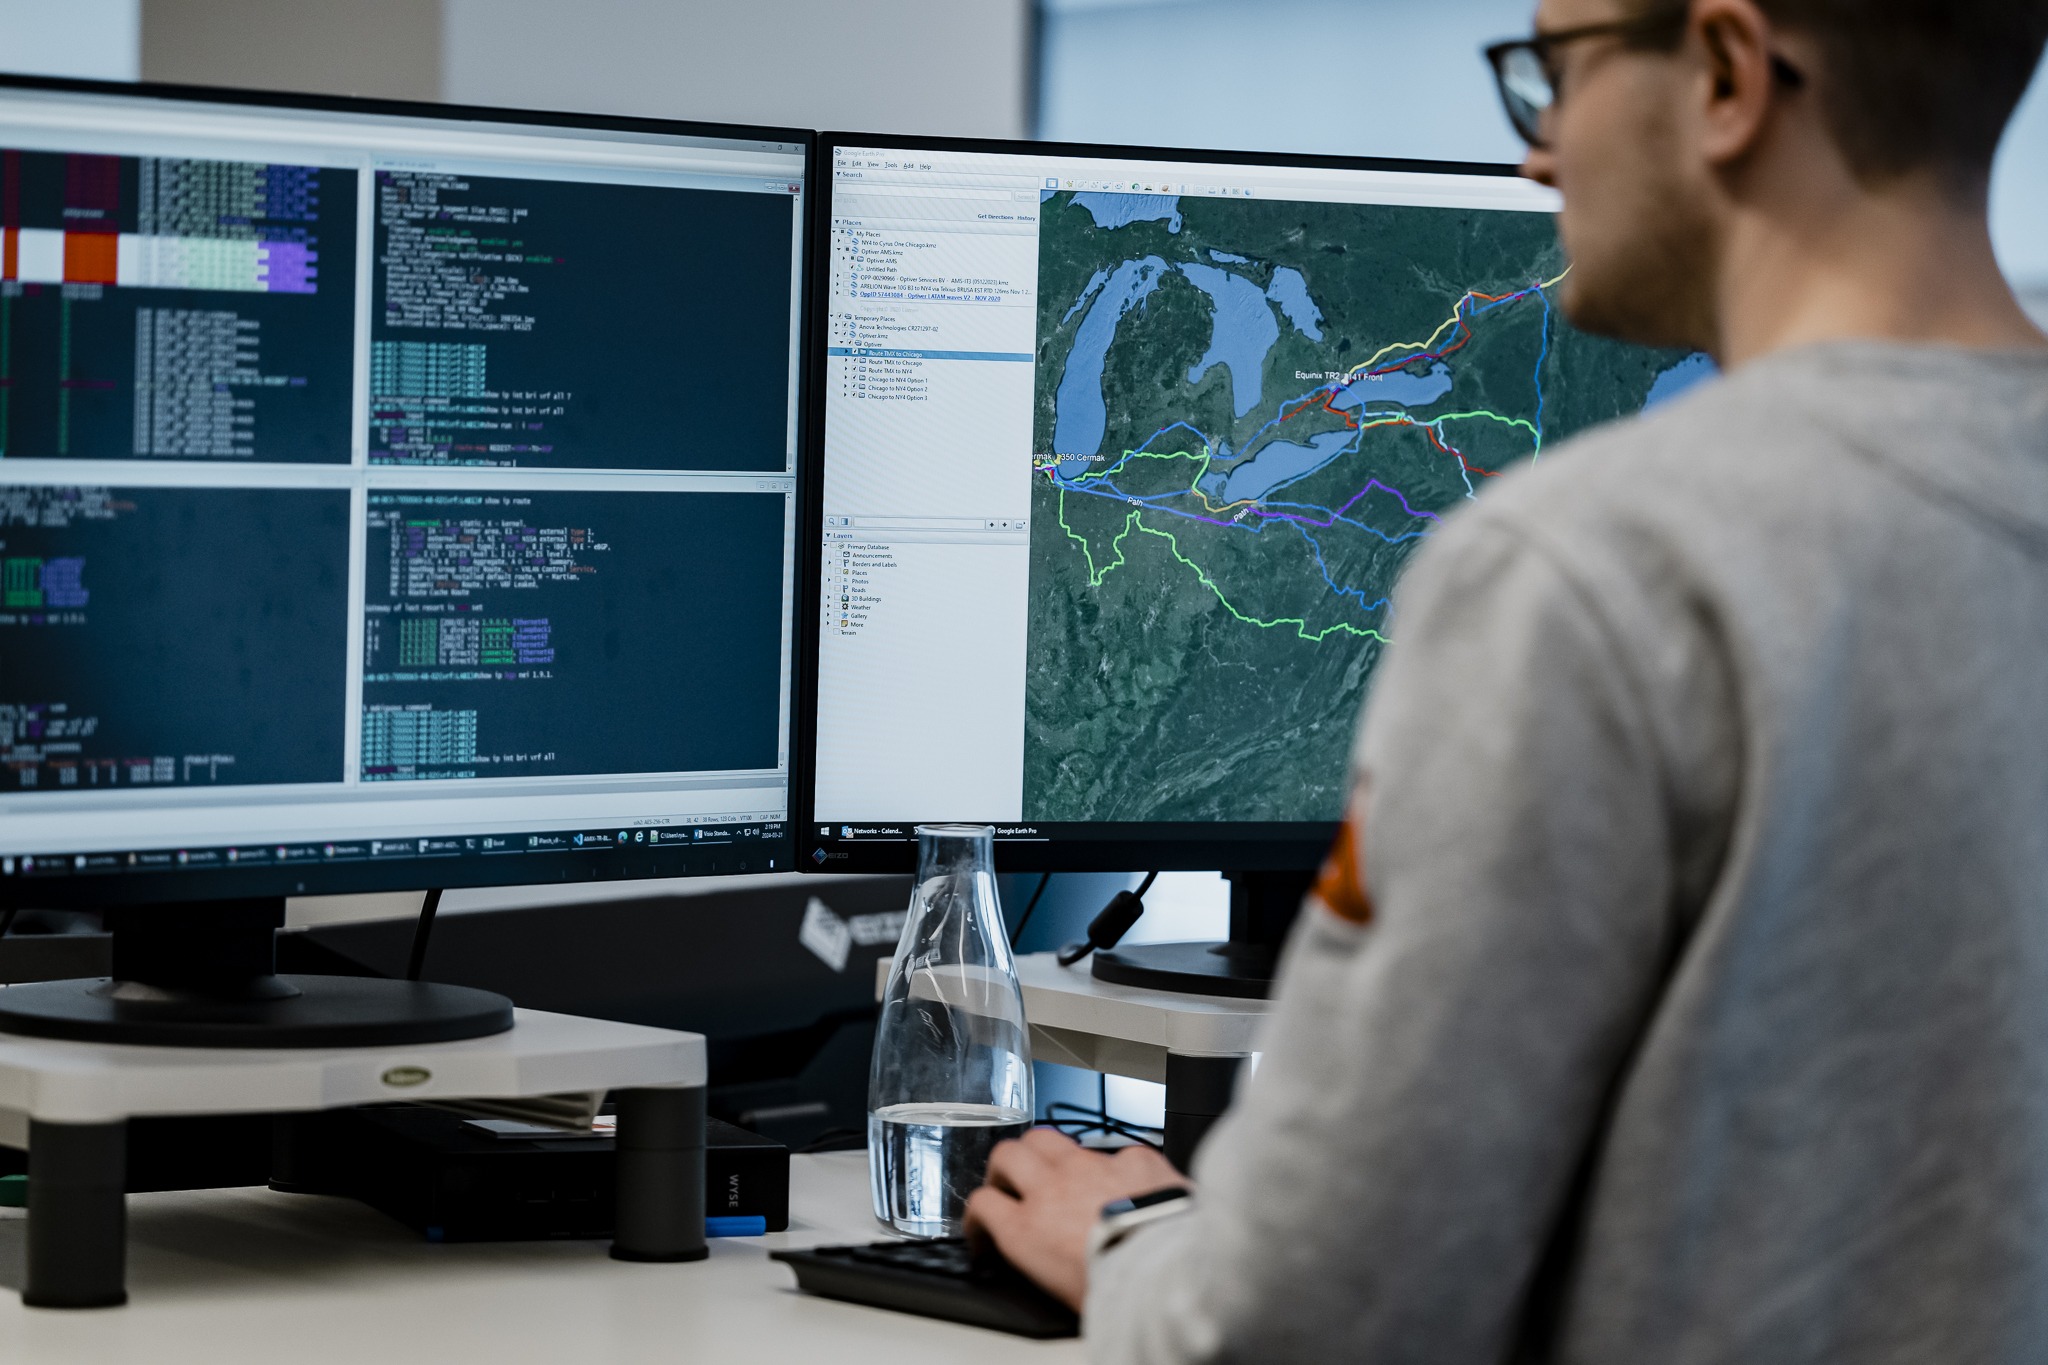
With hundreds of heavy applications displaying different data simultaneously across multiple desktops, and millions of data points generated every second, the need for fast and efficient processing, even during busy market conditions, is critical. The challenge of managing the processing of this data, as well as creating visually appealing and functional formats, requires innovative solutions and cutting-edge tools.

“In the financial industry, we have hundreds of applications displaying various market data simultaneously for a single trader. Traders want to see a lot of data at the same time in a compact format, which comes with some unique scaling challenges.”
Collaboration with traders
Understanding the needs of traders is the first step in creating effective data visualisations. At Optiver, engineers continually collaborate with traders, researchers and other business stakeholders to identify the most important data to visualise, including real-time market data, historical trends, risk metrics, types of financial instruments and more.
Once we’ve identified the data that matters most, our engineers work to optimise the workflows of our traders by creating custom visualisation tools. These tools are designed to present complex financial data in an easily digestible format, allowing traders to quickly identify patterns and trends that may impact their strategies. By streamlining the decision-making process, we’re able to improve the overall efficiency of our trading operations.

Optimising workflows through visualisation
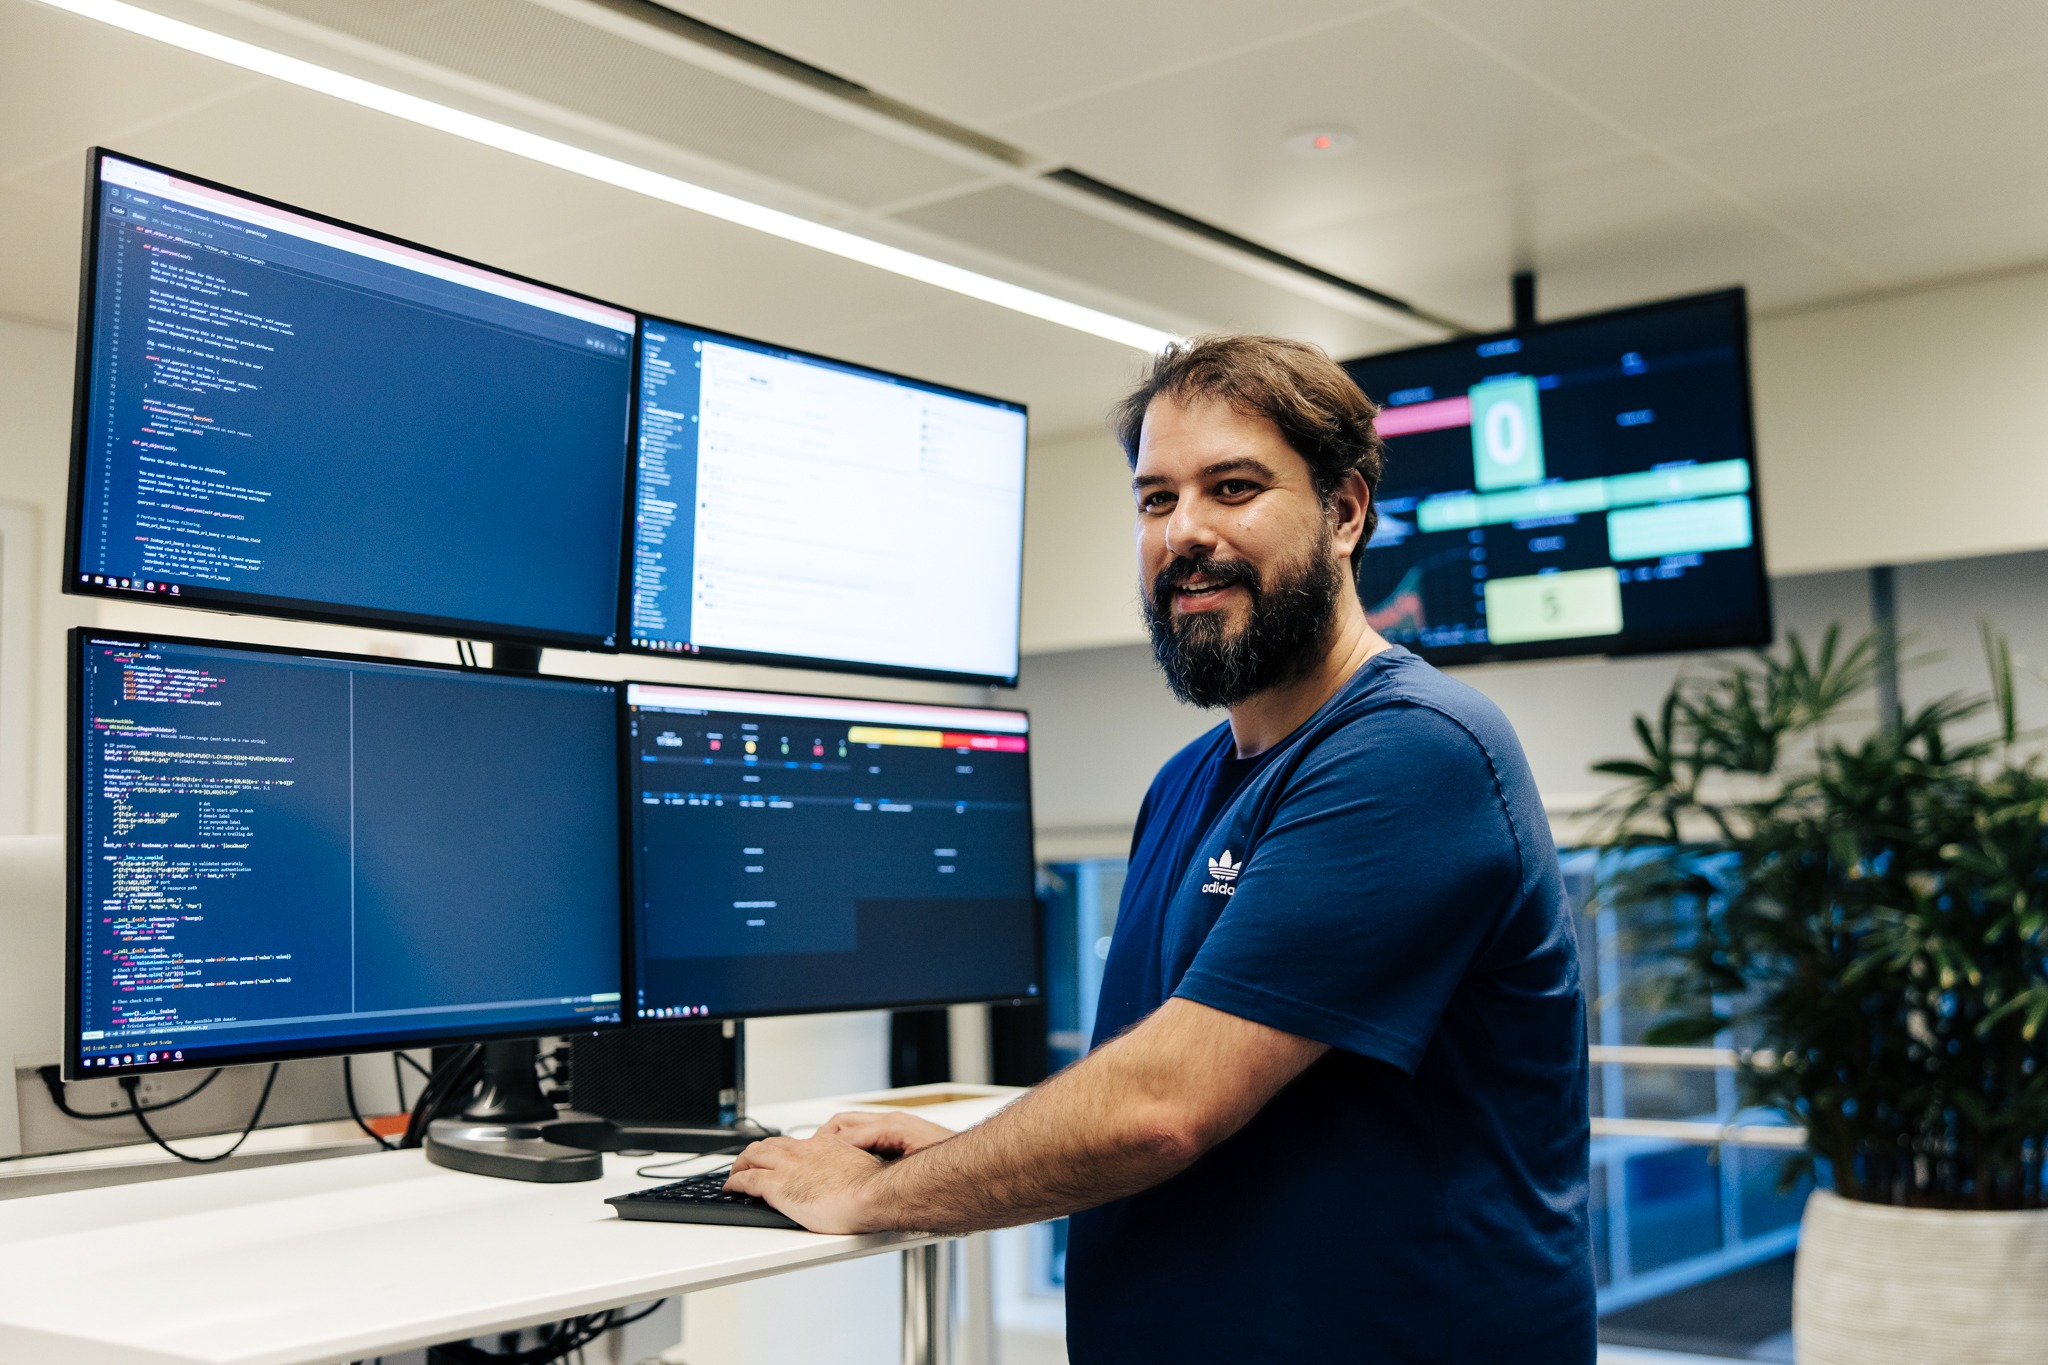
Once we’ve identified the data to display, our engineers set out to design impactful visualisations to optimise traders’ workflows. At Optiver, we recognise the importance of both high-performance tools for critical applications and innovative data visualisations. Our C# engineers focus on high-performance visualisations and tools that are crucial for trading operations, especially during busy market conditions. These tools need to be extremely reliable and performant. For example, a tool that provides an overview of the financial instruments being traded enables traders to make quick, informed decisions. Engineers achieve this by using C# GUIs for Windows-based applications and tightly coupling them to C++ backends for optimal performance.
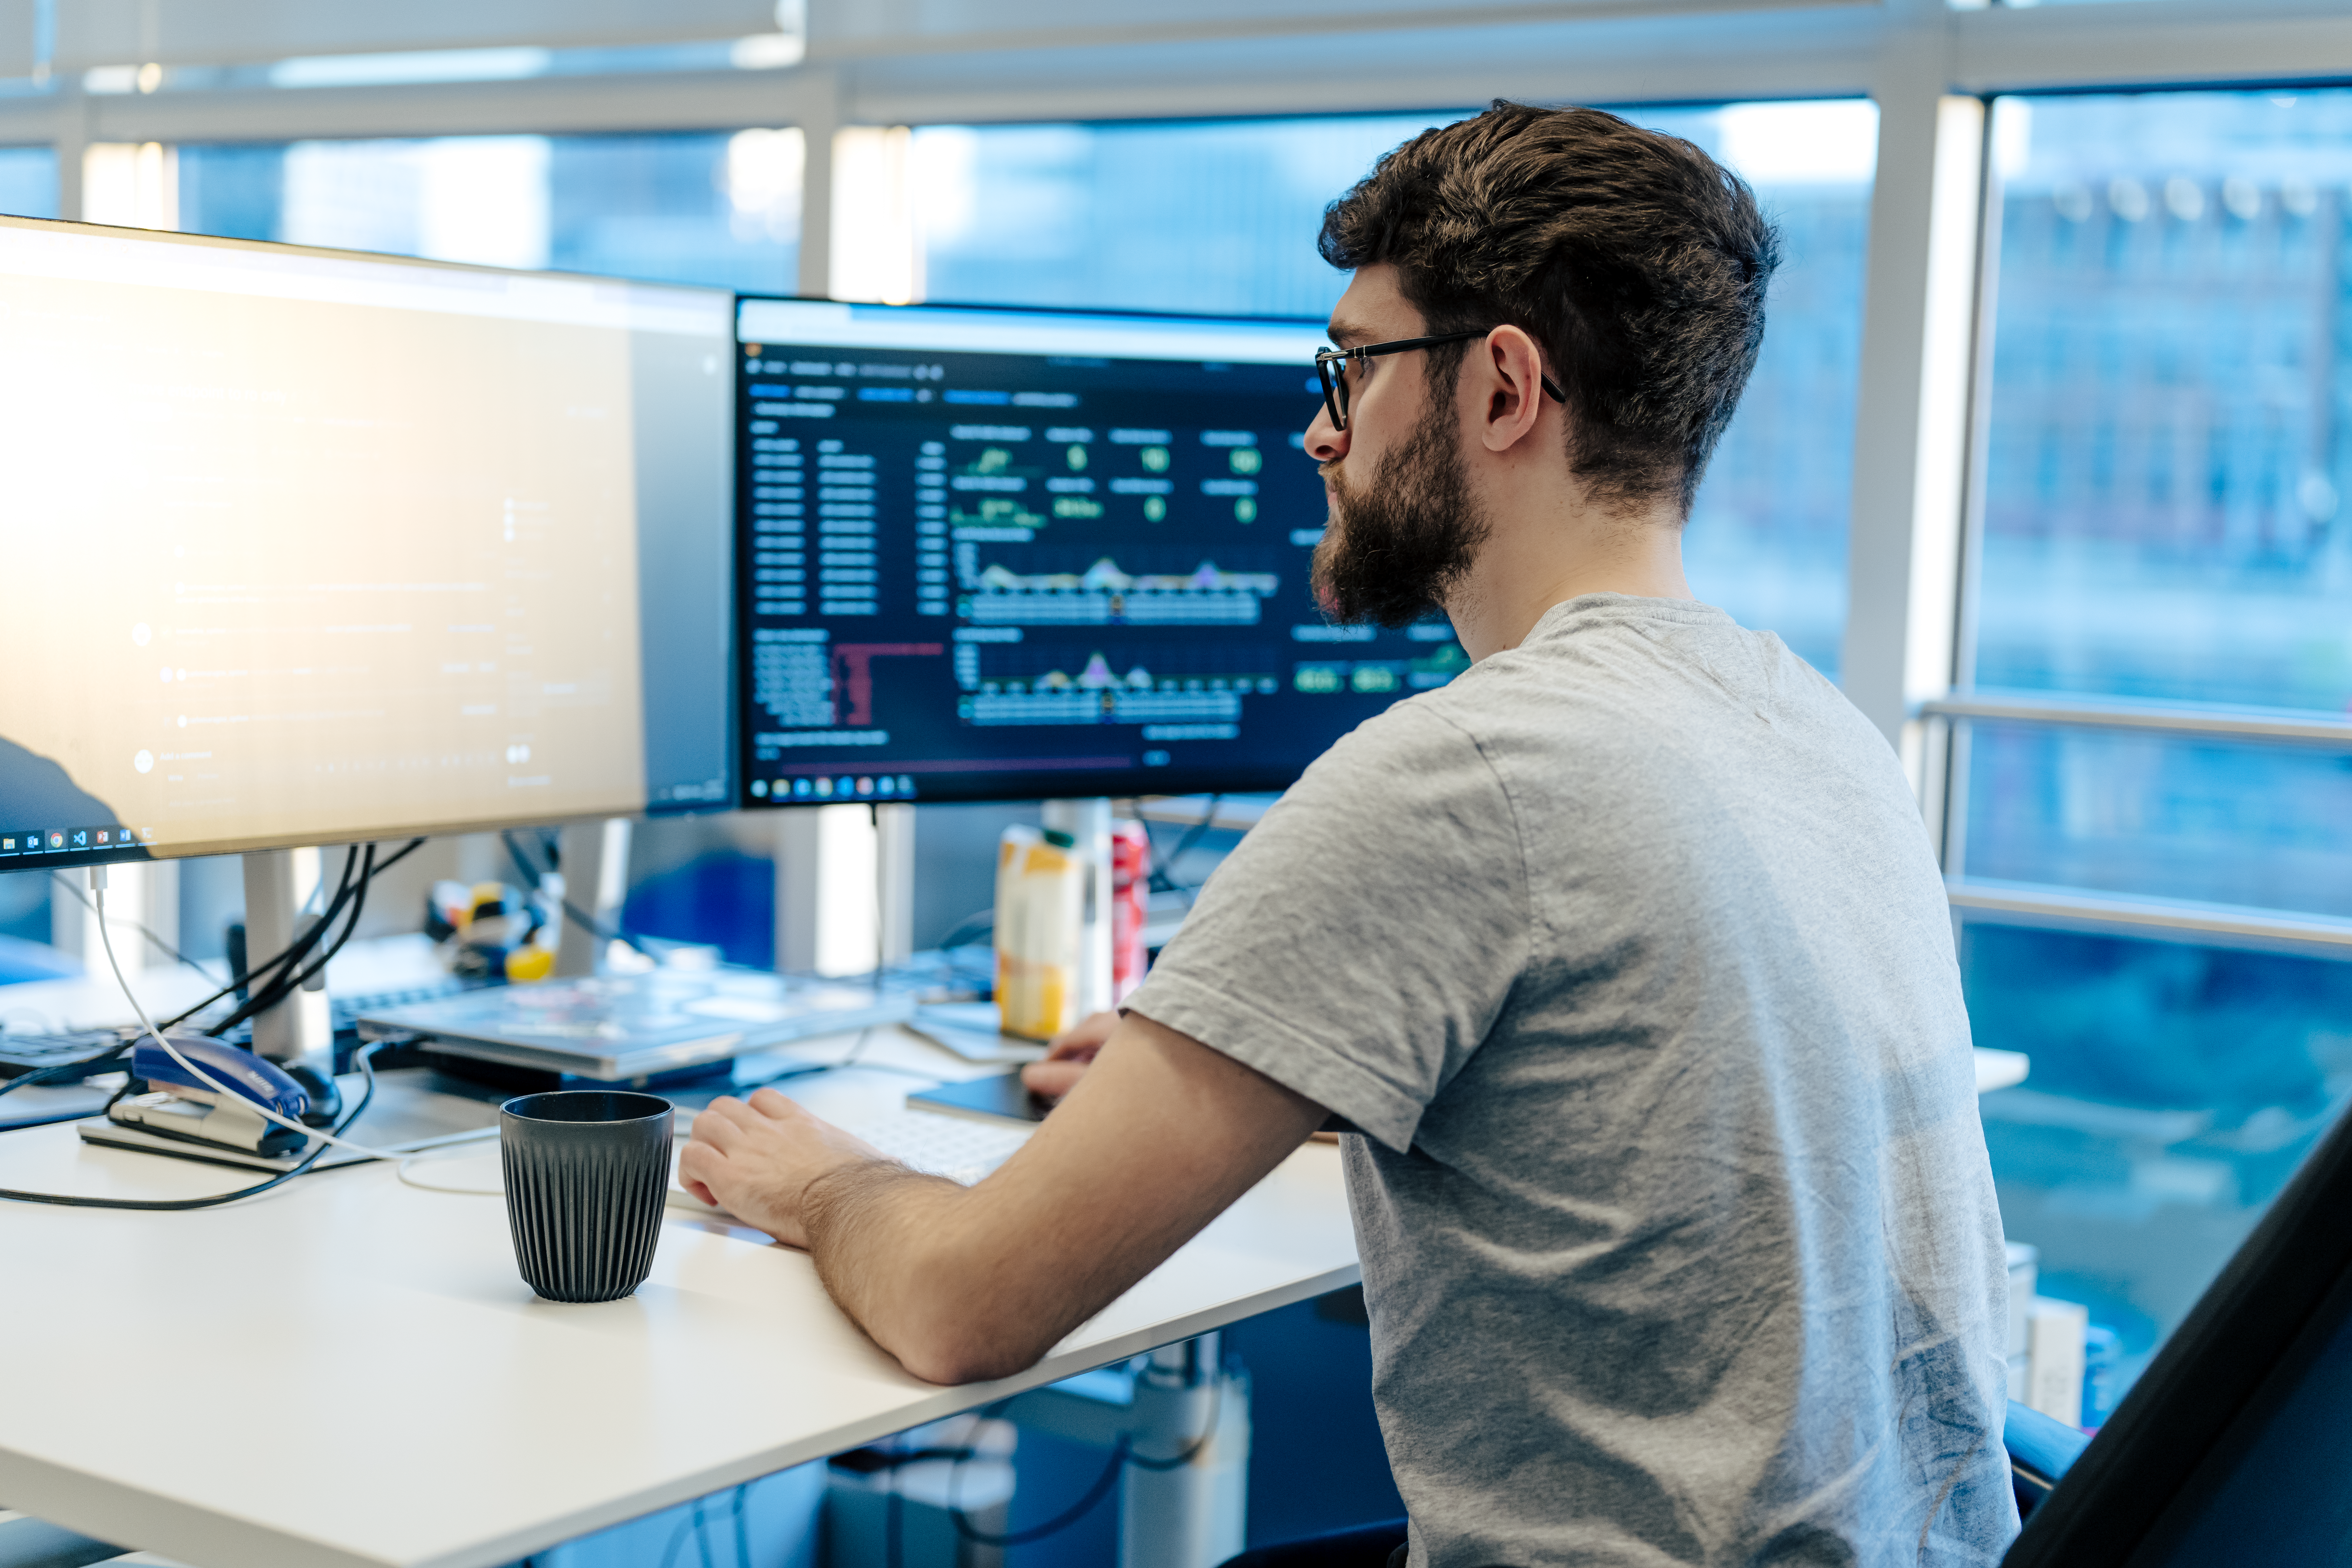
Simultaneously, harnessing the power of Python and web technologies such as React JS and JavaScript, our engineers develop bespoke and responsive dashboards that capture the dynamic nature of trading environments, all while capturing traders specific needs.
By utilising state-of-the-art Python visualisation frameworks like Dash and Bokeh, Optiver’s visualisation engineers build tailored, interactive and data-rich dashboards that present complex financial data in an accessible and engaging format. These dashboards encompass a wide range of visualisation types, such as time-series charts, heat maps, network graphs, and bar charts, to help traders quickly identify emerging patterns, trends and relationships within real time and historical market data. As well as providing a comprehensive view of the market, these dashboards are designed with efficiency and ease of use in mind, allowing traders to easily navigate through the visualisations and extract the insights they need at any moment. As a result, Optiver engineers play an integral role in enhancing traders’ performance by delivering streamlined visualisation tools that empower them to analyse vast amounts of data, stay ahead of market movements and execute strategies with confidence.
Real-time and historical data
To provide the best possible data visualisations, our engineers must balance real-time and historical data. Real-time data allows our traders to stay up to date with market developments, while historical data helps them spot trends and develop informed strategies. Managing compute power effectively is crucial for delivering both types of data. At Optiver, our engineers have developed efficient systems to manage this balance, ensuring that our traders have access to the information they need without overwhelming our infrastructure.

“One of the most interesting challenges in our job is visualising immense amounts of data in a smart way. And in a world that’s only getting more data driven, it’s only going to become more important to know how to visualise this data effectively.”
Join our teams
If you have a passion for data visualisation and want to make an impact at Optiver, check out our open data visualisation roles and start your journey with us today.